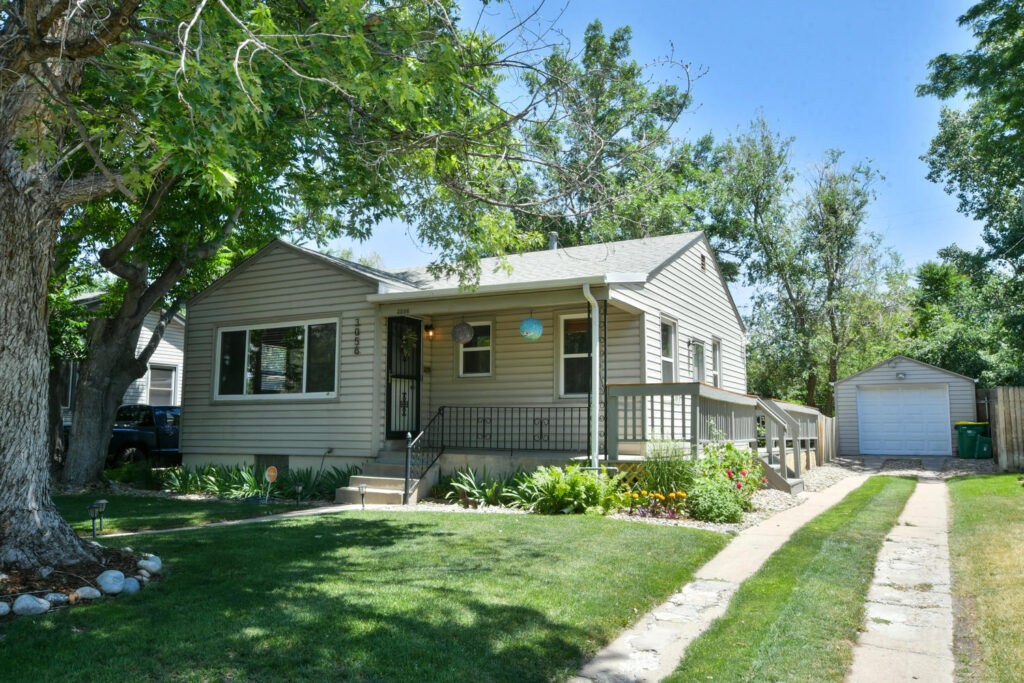
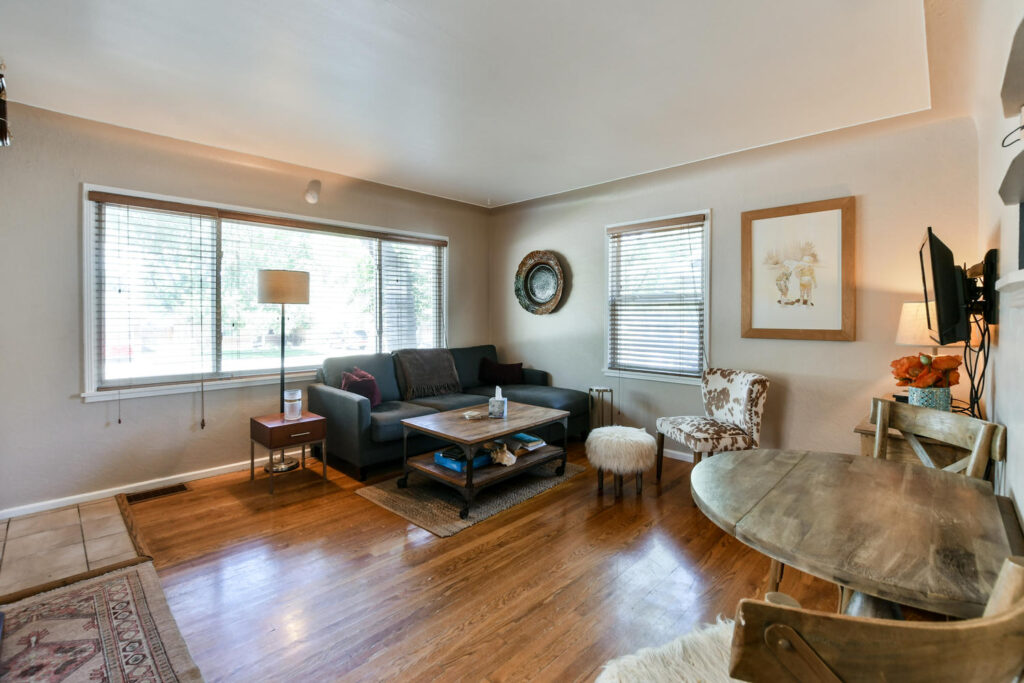
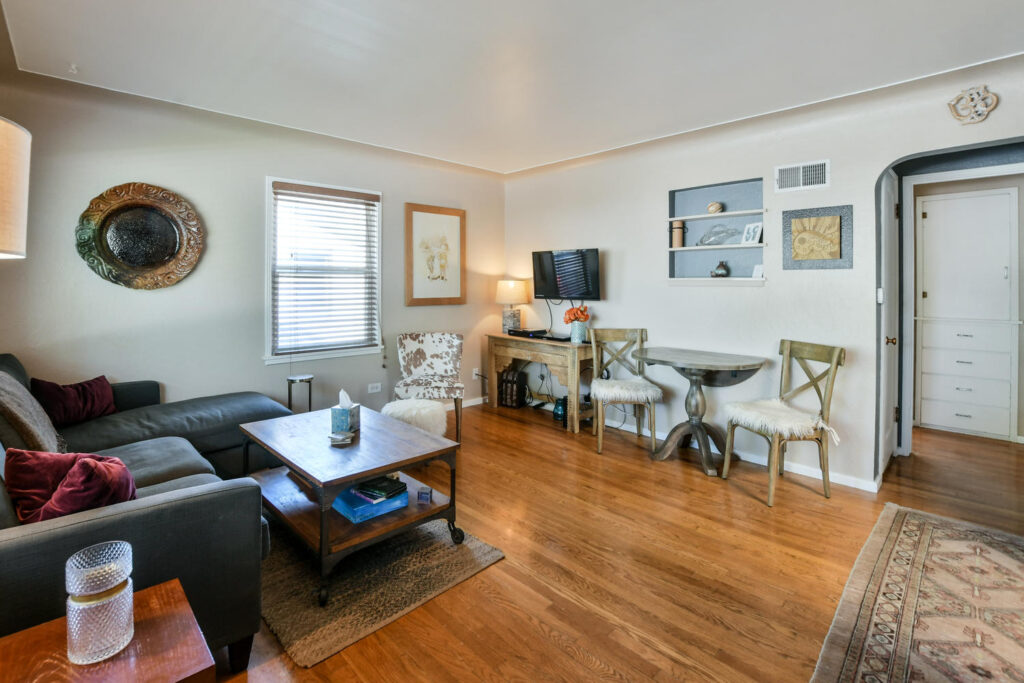
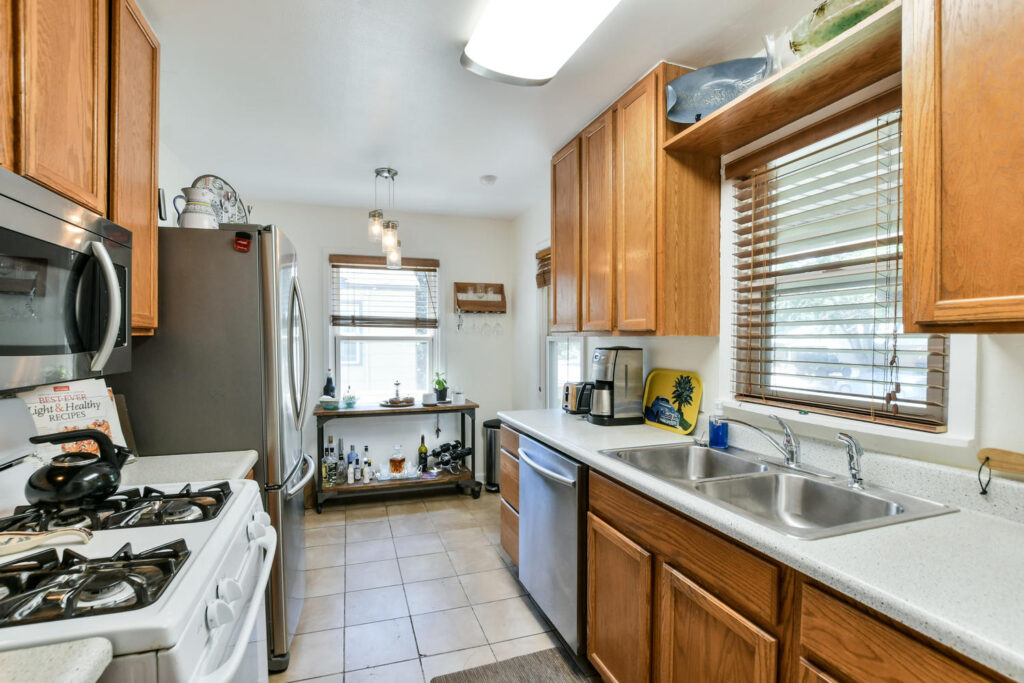
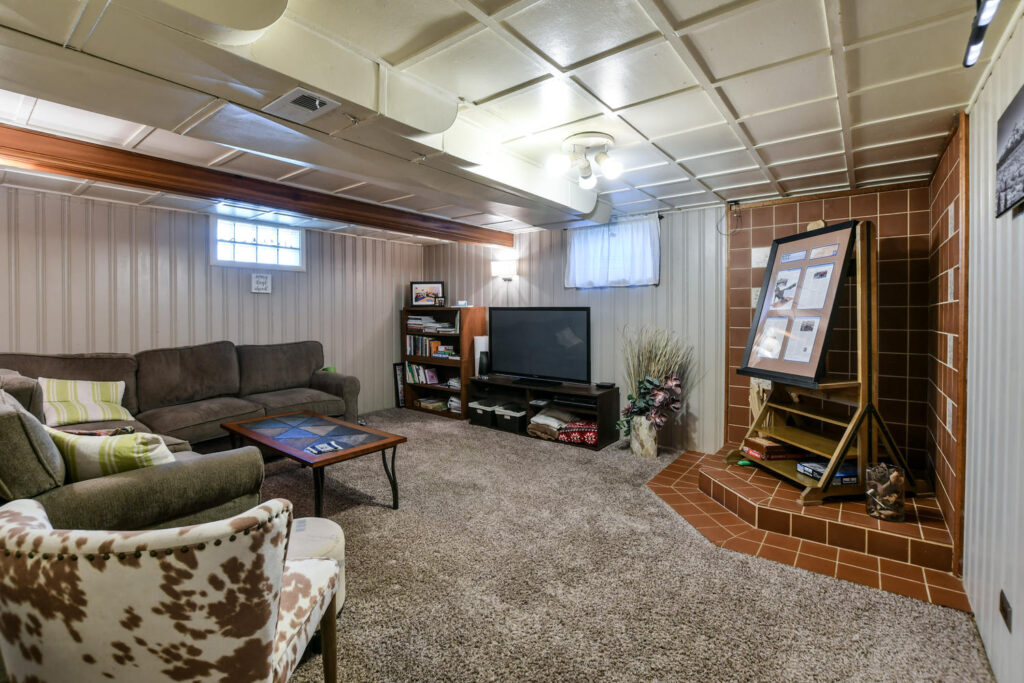
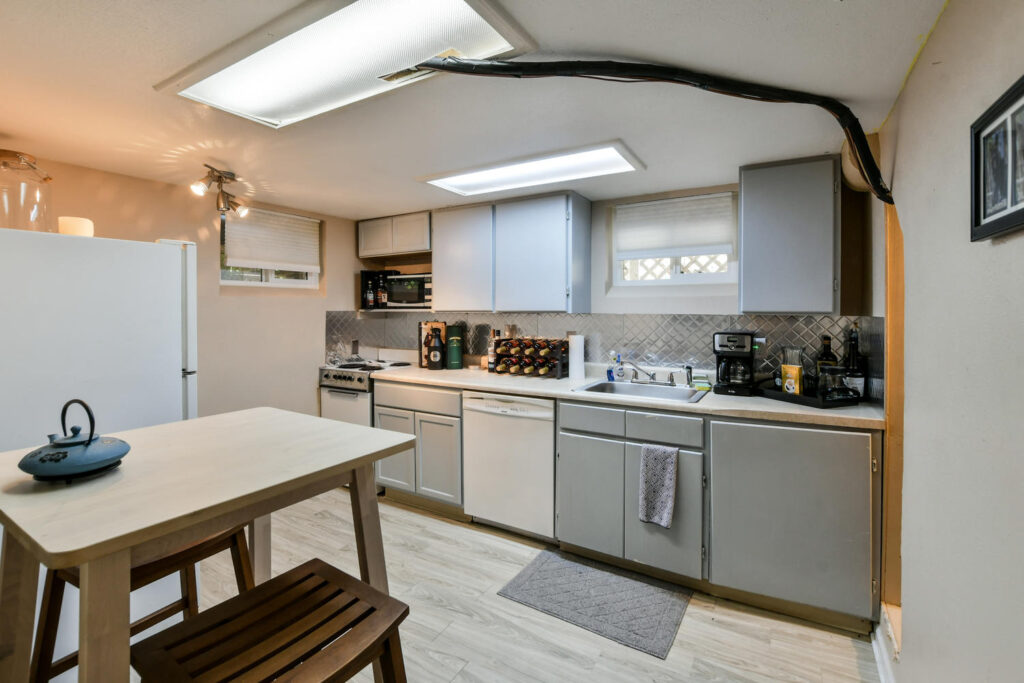
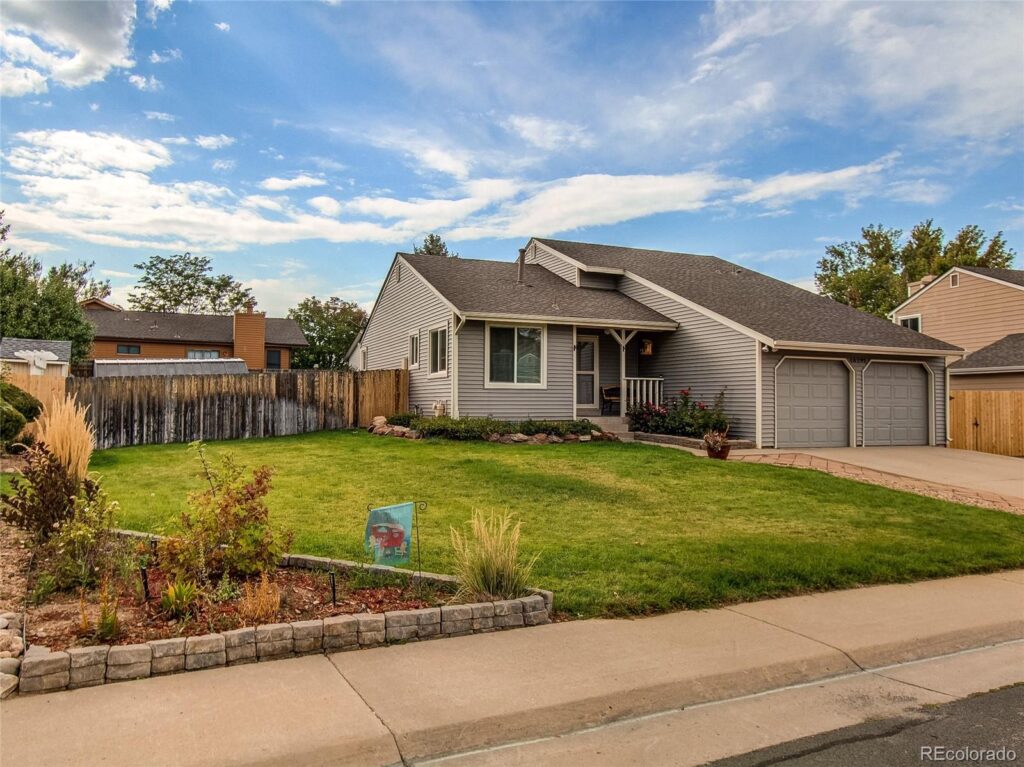
Come discover this delightful home with two bedrooms and bath upstairs, along with an inviting living space and a kitchen with a gas stove, plus newer fridge, microwave, and dishwasher! Included in this home is an EXTRA second living space downstairs which contains another bedroom, bath, living area, and kitchen! Combine all of that with a backyard to help you get away from it all. This oasis includes a water feature, a pergola, and beautiful well-planned landscape to make you feel undisturbed and peaceful. In addition, this home was been well cared for, there is new paint on the deck and the roof, furnace and air conditioning are just several years old! No HOA and quick access to downtown and DTC. This one will go fast, don’t let yourself miss out on this amazing retreat!
You won’t want to miss this opportunity in highly sought after Smoky Hill 400 Community! Located in award winning Cherry Creek School District, this location gives you immediate access to Cherry Creek State Park and Reservoir, Aurora Reservoir, community trails, parks, pool, clubhouse and Minutes to Southlands, C470, 225, Light Rail! You will fall in love when you pull up, Newer exterior paint, nicely landscaped yard with plenty of parking including attached 2 car garage and RV parking! This home sits on a massive 8100+ square foot lot with, flag stone patio, large shed and tons of space for all your entertaining needs! Step inside, to a kitchen oasis, this was converted to full open contemporary concept with massive kitchen and island with vaulted ceiling and huge dinning area! Stainless steel appliances, Custom cabinets, granite styling laminate counter tops, engineered wood and custom tile flooring! You won’t find another one like this! Upstairs enjoy a huge master bedroom with additional retreat area (could be converted to bedroom)! Lower level and basement has 3 additional bedrooms. 2 updated full baths with a fully roughed in 3rd bath the can easily finished, even comes with finish materials! Basement bedrooms are non conforming and could be used as additional open space living area! You will truly love to call this place home! All this, at this price point and this location, you won’t want to wait!
Some of the Neighborhood’s Data Points:
Right now, there are 5 active Smoky Hill Homes on the market.
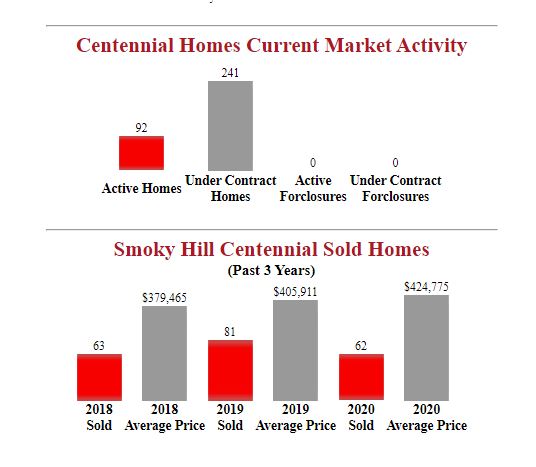
Right now, there are 92 active Centennial Homes on the market.
There are Currently 5 under contract Smoky Hill Homes on the market.
There are currently 241 under contract Centennial Homes on the market.
Average prices increased $18,864.00 over the last year from $405,911 to $424,775.
It’s always nice to see home prices in Smoky Hill Centennial rise year-over-year. We’ll see if this trend continues in the months to come.
Many factors go into a report like this. We can get deeper into the details with your personaly if you would like. Want more stats or numbers for this or another area? Give us a call today at 303-726-1874.
Smoky Hill Centennial Sold Home Data By Month (Past 5 Years)
*This is list of the most recent sold homes for the Smoky Hill Centennial area. Not all homes were sold by The Brian Petrelli Team.
Based on information from REcolorado®, Inc. for the period 2015 through 2020 Note: This representation is based in whole or in part on content supplied by REcolorado®, Inc. REcolorado®, Inc. does not guarantee nor is it in any way responsible for its accuracy. Content maintained by REcolorado®, Inc. may not reflect all real estate activity in the market.
Contact Us Today For More Information 303-726-1874
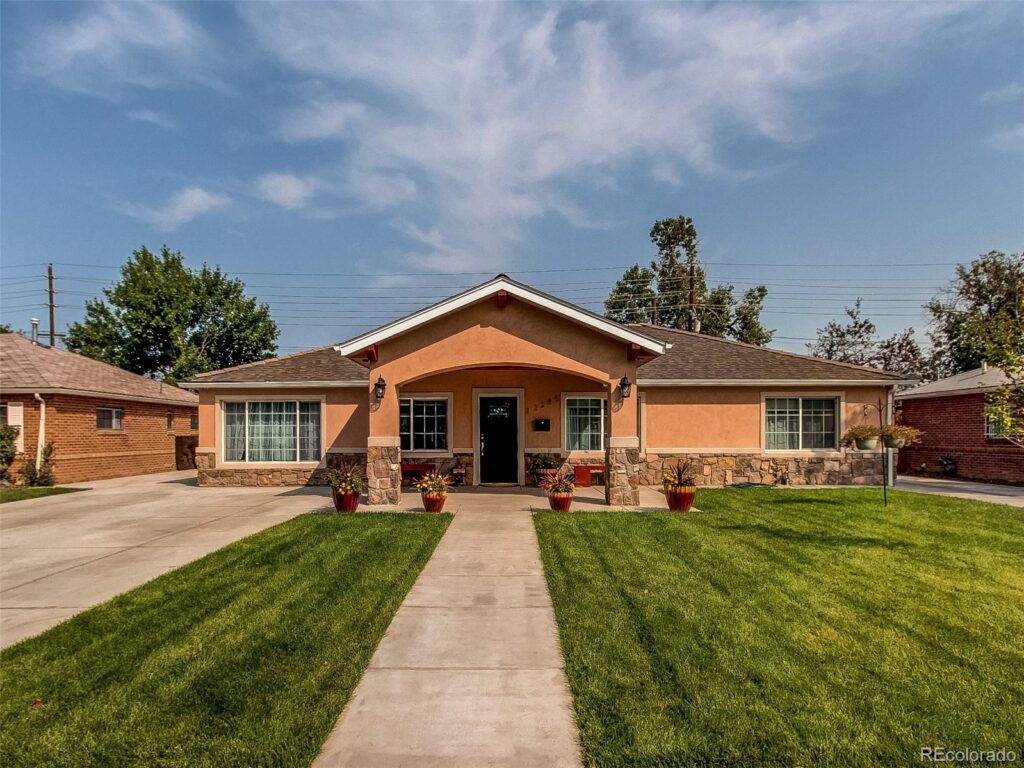
Hurry to see this rare gem in thriving area! Truly must see to appreciate, this home features stunning remodel throughout! Starting with the kitchen granite counters tops, high end cabinets, granite island, custom back splash, pendant and can lighting! Living room with accent stone wall with fireplace! Custom tile flooring and engineered flooring throughout! Contemporary paint, new light fixtures, ceiling fans, windows, and electrical! Updated bathrooms include fixtures, vanities, tile and lighting! Master bedroom suite with master bathroom! Full dining room area with custom lighting and added can lighting! 4th non conforming bedroom used as office or study (this home has additional finished square footage not listed in public record!) Truly a custom styled and finished home! Exterior boasts custom stucco and stone work, massive off street parking with double driveways! Massive 8000 plus square foot lot with front and rear sprinkler system! Huge double patios perfect for all your entertaining events! This oasis also backs to Jewel park and is located in one of the hottest thriving markets in the Metro Area with immediate access to Fitzsimons Medical Complex, Children’s Hospital, Anchutz Medical Complex, New VA Hospital, 225, I-70 Light rail, Colfax, Central Park, formerly known as Stapleton, Lowry, Buckley AFB, the list goes on! THIS IS IT!
Some of the Neighborhood’s Data Points:
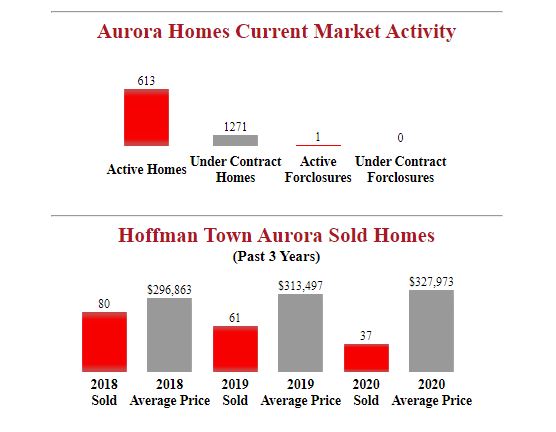
There are 6 active Hoffman Town Homes on the market.
There are 613 active Aurora Homes on the market.
There are Currently 14 under contract Hoffman Town Homes on the market.
There are currently 1271 under contract Aurora Homes on the market.
Average prices increased $14,476.00 over the last year from $313,497 to $327,973.
It’s always nice to see prices in Hoffman Town Aurora rise continually year-over-year. We’ll see if this trend continues in the months to come.
This is a great deal of data aggregated into a few charts. We would be happy to seperate this out into a more manageable report. Our team is always happy to help. Give us a call today at 303-726-1874.
Hoffman Town Aurora Sold Home Data By Month (Past 5 Years)
Year
January
February
March
April
May
June
July
August
September
October
November
December
2019
5
4
8
0
9
3
8
2
4
4
9
5
2018
8
4
8
4
11
6
10
7
2
6
7
7
2017
4
2
6
9
3
12
9
7
6
6
5
6
2016
0
0
0
0
0
0
0
0
0
0
0
0
2015
0
0
0
0
0
0
0
0
0
0
0
0
Recent Sold Hoffman Town Aurora Homes*:
This is a list of the most recent sold Homes. Visit our website for a complete list of all Sold Hoffman Town Aurora Homes.
Address
Sqft
Beds
Baths
Price
Close Date
1101 N Wheeling Street
1384
3
2
$325,000
2020-09-14
881 Salem Street
1401
3
2
$353,000
2020-08-31
730 Tucson Street
1625
3
2
$252,800
2020-03-13
730 Tucson Street
1625
3
2
$380,000
2020-08-04
798 Troy Court
1656
3
2
$352,000
2020-07-29
900 Vaughn Street
1072
3
2
$329,000
2020-07-17
12710 E 7th Avenue
1650
4
4
$375,000
2020-07-23
869 Salem Street
1401
3
2
$339,043
2020-07-17
1077 Ursula Street
1621
3
2
$372,000
2020-05-05
907 Victor Street
1074
3
2
$307,500
2020-07-10
*This is list of the most recent sold homes for the Hoffman Town Aurora area. Not all homes were sold by The Brian Petrelli Team.
Based on information from REcolorado®, Inc. for the period 2015 through 2020 Note: This representation is based in whole or in part on content supplied by REcolorado®, Inc. REcolorado®, Inc. does not guarantee nor is it in any way responsible for its accuracy. Content maintained by REcolorado®, Inc. may not reflect all real estate activity in the market.
Contact Us Today For More Information 303-726-1874
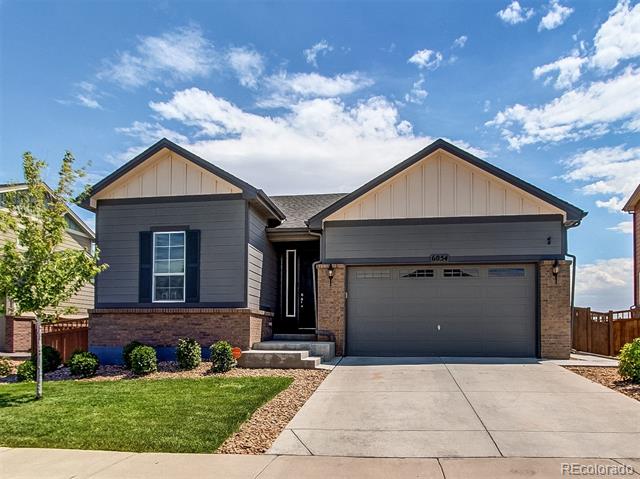
This opportunity is better than buying a new build, but with all the benefits of new modern construction! No waiting for construction, move into your new home now!! Step into this massive ranch home with just over 3100 square feet and was built only 3 years ago! Upgrades galore include, engineered wood flooring throughout main living areas, towering ceilings and doors, huge open layout starting with massive kitchen with huge island with granite on all countertops, stainless steel appliances, modern backsplash and cabinets. Kitchen overlooks dining area and expansive family room! Modern paint throughout with all main level living. Huge master bedroom features a master bath with tile finish, double vanity, walk in closets, and full shower and bath. 2 bedrooms and additional full bath also all on main floor. Basement features tall 9 foot ceilings with over 1500 square feet of un- finished space ready for any of your design ideas! Easily add additional rooms, baths, entertainment area, gym area, enough space for it all!!! Finally you will love entertaining with almost 7000 square foot lot, back yard features large custom concrete patio and side of house walkway, along with large grass area for pets, kids and parties alike! This location is phenomenal with immediate access to DIA, I-70, 470, train and light rail, minutes to the Gaylord Resort and Convention Center! Don’t hesitate to jump on this home, inventory is low but you have a chance to get this home now and take advantage of rates now!
Our team just sold a fantastic home in High Point Aurora. As we continue to see record high demand for Aurora Homes, we are searching the MLS daily for new homes and updating our clients on sold prices. We just created this report for one of our team’s clients, and thought it was worth posting here.
Some of the Area’s Highlights:
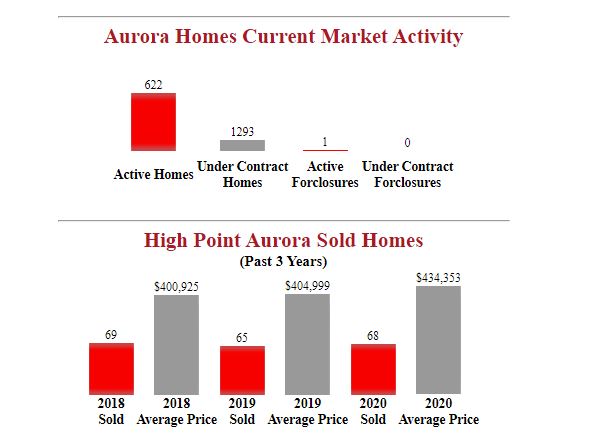
Right now, there are 622 active Aurora Homes on the market.
There are 1293 under contract Aurora Homes on the market.
Average prices increased $29,354.00 over the last year from $404,999 to $434,353.
A quick look at these numbers shows that home prices in High Point Aurora continue to rise year-over-year. Hopefully, this trend continues.
While this is a wide overview of the market, we can create a more focused, personalized report for you. If you would like our team to complete a detailed market review for your neighborhood. Just give us a call at 303-726-1874.
High Point Aurora Sold Home Data By Month (Past 5 Years)
Year
January
February
March
April
May
June
July
August
September
October
November
December
2019
2
3
4
6
8
7
9
5
6
7
3
5
2018
8
8
8
7
11
5
4
5
2
4
4
3
2017
1
3
5
6
6
7
7
3
8
6
7
5
2016
0
0
0
0
0
0
0
0
0
0
0
0
2015
0
0
0
0
0
0
0
0
0
0
0
0
Recent Sold High Point Aurora Homes*:
This is a list of the most recent sold Homes. Visit our website for a complete list of all Sold Aurora Homes.
Address
Sqft
Beds
Baths
Price
Close Date
19428 E 62nd Avenue
1609
2
3
$415,000
2020-08-31
6151 N Dunkirk Court
4242
6
4
$497,000
2020-08-28
20054 E 62nd Drive
1635
3
2
$410,000
2020-08-26
6054 N Genoa Way
1562
3
2
$439,800
2020-08-27
19528 E 60th Place
3089
5
4
$480,000
2020-08-25
6303 N Ensenada Court
1833
4
3
$419,000
2020-08-25
6358 N Halifax Court
1829
3
3
$410,000
2020-08-19
20028 E 62nd Avenue
2385
3
3
$440,380
2020-08-13
6335 N Espana Street
1965
3
3
$410,000
2020-08-11
20068 E 62nd Avenue
2716
5
4
$469,585
2020-08-10
*This is list of the most recent sold homes for the High Point Aurora area. Not all homes were sold by The Brian Petrelli Team.
Based on information from REcolorado®, Inc. for the period 2015 through 2020 Note: This representation is based in whole or in part on content supplied by REcolorado®, Inc. REcolorado®, Inc. does not guarantee nor is it in any way responsible for its accuracy. Content maintained by REcolorado®, Inc. may not reflect all real estate activity in the market.
Contact Us Today For More Information 303-726-1874
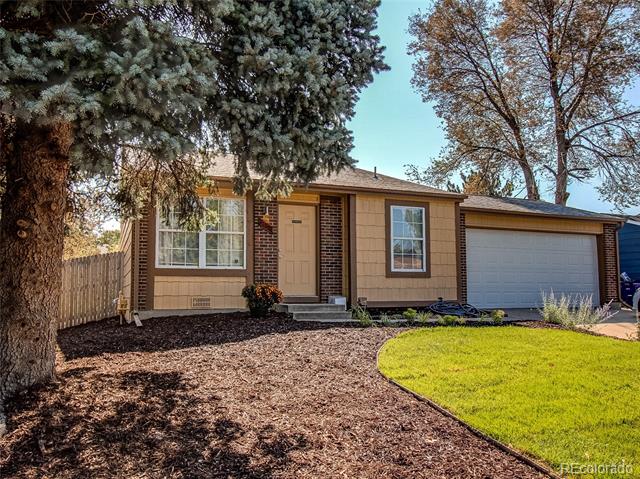
Our team is thrilled to announce our newest listing in Montbello Denver. This 2 bedroom / 2 bath home is priced at $335,000. Make sure you click on the link above to see all of the photos and virtual tour.
The demand for Denver Homes remains extremely high as Buyers continue their struggle to find available homes. We know the tough market is causing a headache for many buyers. We wanted to post some of the most recent numbers here.
Recent Market Statistics:
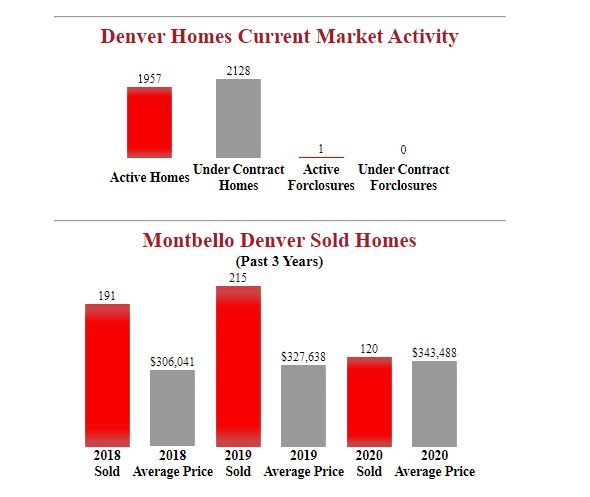
There are Currently 7 active Montbello Homes on the market.
There are currently 1957 active Denver Homes on the market.
Average prices increased $15,850.00 over the last year from $327,638 to $343,488.
It’s always nice to see prices in Montbello Denver rise continually year-over-year. We’ll see if this trend continues in the months to come.
Please remember these stats are a broad overview and encompase a great deal of data. We can get more detailed for you upon request. Want more stats or numbers for this or another area? Give us a call today at 303-726-1874.
Montbello Denver Sold Home Data By Month (Past 5 Years)
Year
January
February
March
April
May
June
July
August
September
October
November
December
2019
15
14
17
16
24
20
22
16
23
13
21
14
2018
12
15
11
19
20
16
15
18
20
17
17
11
2017
5
14
25
15
21
19
23
24
16
17
26
27
2016
0
0
0
0
0
0
0
0
0
0
0
0
2015
0
0
0
0
0
0
0
0
0
0
0
0
Recent Sold Montbello Denver Homes*:
This is a list of the most recent sold Homes. Visit our website for a complete list of all Sold Montbello Denver Homes.
Address
Sqft
Beds
Baths
Price
Close Date
4972 Titan Way
1762
3
2
$385,000
2020-08-26
4801 Quentin Street
1665
4
3
$378,000
2020-08-26
15045 E 54th Avenue
1060
3
1
$300,000
2020-08-20
4587 Granby Way
1923
3
2
$395,000
2020-08-21
5051 Titan Way
1862
3
2
$350,000
2020-08-18
5527 Revere Street
858
4
2
$355,000
2020-08-20
15076 Kelly Place
1712
3
2
$365,000
2020-08-20
5536 Tulsa Way
1683
4
2
$389,000
2020-07-31
12983 E 47th Avenue
1714
3
2
$355,000
2020-08-10
14400 Albrook Drive
1345
2
3
$193,500
2020-08-12
*This is list of the most recent sold homes for the Montbello Denver area. Not all homes were sold by The Brian Petrelli Team.
Based on information from REcolorado®, Inc. for the period 2015 through 2020 Note: This representation is based in whole or in part on content supplied by REcolorado®, Inc. REcolorado®, Inc. does not guarantee nor is it in any way responsible for its accuracy. Content maintained by REcolorado®, Inc. may not reflect all real estate activity in the market.
Contact Us Today For More Information 303-726-1874
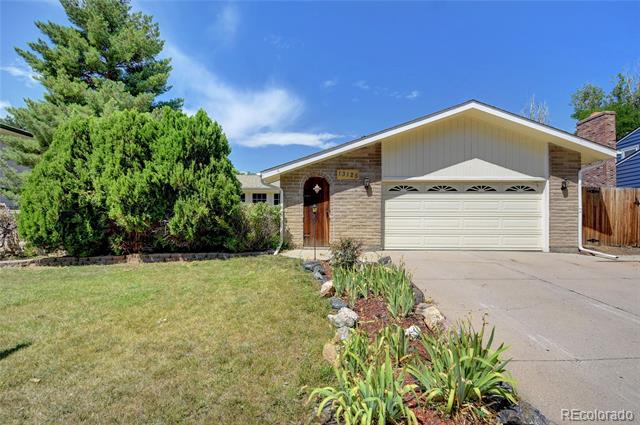
You will enter through the front gate in to the private front court yard and through the front door to view the Appealing floorplan with Living, Dining Room, Kitchen and Entry way on main level with Sunroom (YES, a sunroom) access from Dining room. Lower Level offers Family Room with fireplace (is viewable from kitchen), 4th bedroom , bath and laundry. Upper level offers Master bdrm and bath and 2 nicely sized secondary bdrms and full bath. Finished partial basement for more bedrooms, game room, great room? You will love the private front and backyards! Newer Cabinetry, Granite Countertops, Gas Range, Stainless Steel Appliances. Laminate and Tile Flooring throughout, Newer furnace (2019), Roof less than 5 yrs. And did I mention the 2 car OS attached garage!! Come and add your touches and a bit of TLC and it will be perfect! Priced to sell ‘As Is’.
Our team just helped our buyers find this great opportunity in Cottonwood Lakes Thornton Homes. While the demand from homebuyers in the market continues to outpace the available homes, our team is constantly keeping an eye on the inventory of Thornton Homes every day, waiting for properties as they are entered into the MLS. We just created this report for one of our team’s clients, and thought it was worth posting here.
Some of the Neighborhood’s Data Points:
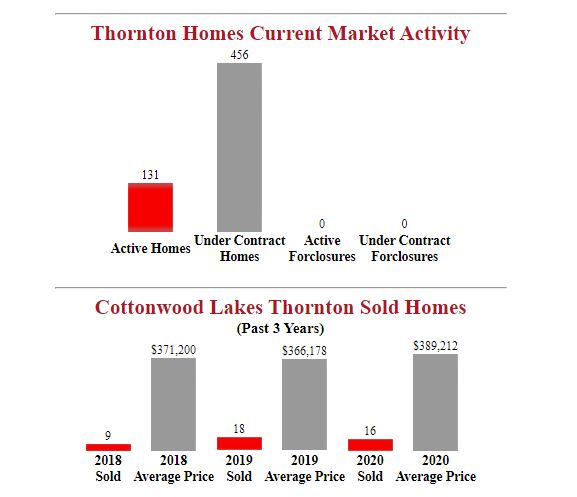
Right now, there are 0 active Cottonwood Lakes Homes on the market.
Right now, there are 131 active Thornton Homes on the market.
There are Currently 2 under contract Cottonwood Lakes Homes on the market.
There are currently 456 under contract Thornton Homes on the market.
Average prices increased $23,034.00 over the last year from $366,178 to $389,212.
We will continue to monitor this area and detail our findings here. We hope to see a price increase in the weeks and months ahead.
Many factors go into a report like this. We can get deeper into the details with your personaly if you would like. We’re here to help. Give us a call today for more information on this, or any other neighborhood in the Metro Denver area.
Cottonwood Lakes Thornton Sold Home Data By Month (Past 5 Years)
*This is list of the most recent sold homes for the Cottonwood Lakes Thornton area. Not all homes were sold by The Brian Petrelli Team.
Based on information from REcolorado®, Inc. for the period 2015 through 2020 Note: This representation is based in whole or in part on content supplied by REcolorado®, Inc. REcolorado®, Inc. does not guarantee nor is it in any way responsible for its accuracy. Content maintained by REcolorado®, Inc. may not reflect all real estate activity in the market.
Contact Us Today For More Information 303-726-1874
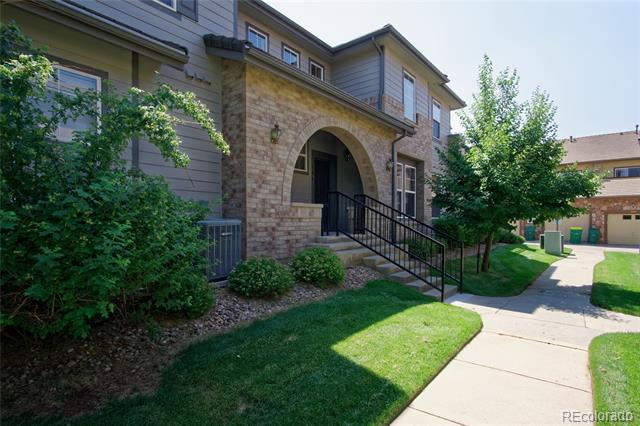
Beds: 2 Baths: 3 Fin SqFt: 1460 Ready To Kick Back And Enjoy Summer? Then Your House Hunt Stops Here! Welcome To 6725 S Winnipeg Cir #106 In The Prairie Ridge At Saddle Rock East Condos. Conveniently Located In Southeast Aurora, This Stunning Condo Was Built In 2002 And Is In Great Move-In Condition. The Light And Bright Home Has Been Well Cared For And Features An Open Concept Main Floor With Sight Lines Stretching From The Kitchen, Dining Area And Family Room. The Gas Fireplace Is A Nice Accent As Are The Soaring Ceilings. Upstairs There Is A Flexible Loft Space With Access To The Outdoor Balcony For Peaceful Morning Coffee Conversations. The Master Suite Boasts A Large Bedroom, Private Four-Piece Bathroom And A Large Walk In Closet. The Is Also A Secondary Bedroom, Full Bathroom, And Laundry Room Upstairs. Recent Updates Include Newer Carpet, Newer Furnace, Newer Stove, Newer Dishwasher, And Newer Microwave. The Attached Two Car Garage (Standard Garage – Not Tandem!) Enters Directly Into This Home. Walk To The Community Pool (Unfortunately Not This Summer Though) And The Nearby Playground. Located Minutes From Southlands Mall And Saddle Rock Golf Course. Other Nearby Favorite Spots Include The Aurora Reservoir, E470 For Easy Commuting Or Airport Access, And Certainly The Highly Sought After Cherry Creek Schools. **Be Sure To Watch The Video Walk Through Tour And The 3d Tour And Schedule Your Private Showing Today!**
The low number of available Aurora Condos still poses challenges from as demand from Buyers remains high. We just created this report for one of our team’s clients, and thought it was worth posting here.
Some of the Neighborhood’s Data Points:
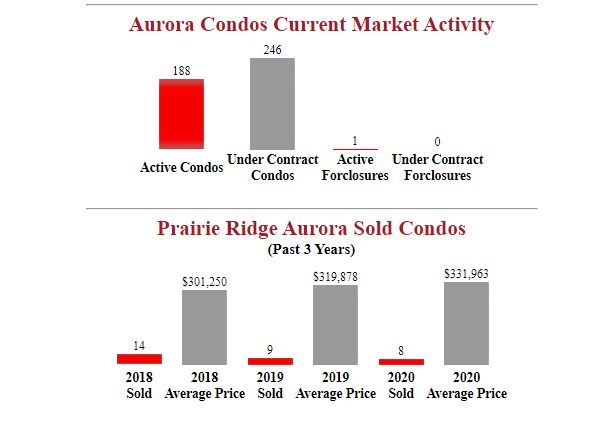
Active Prairie Ridge Condos on the market: 0.
Active Aurora Condos on the market: 188.
There are Currently 5 under contract Prairie Ridge Condos on the market.
There are currently 246 under contract Aurora Condos on the market.
Average prices increased $12,085.00 over the last year from $319,878 to $331,963.
A quick look at these numbers shows that home prices in Prairie Ridge Aurora continue to rise year-over-year. Hopefully, this trend continues.
This data can be a bit complicated. We are always happy to focus our reports or send you more specific details at your request. We’re here to help. Give us a call today for more information on this, or any other neighborhood in the Metro Denver area.
Prairie Ridge Aurora Sold Home Data By Month (Past 5 Years)
*This is list of the most recent sold homes for the Prairie Ridge Aurora area. Not all homes were sold by The Brian Petrelli Team.
Based on information from REcolorado®, Inc. for the period 2015 through 2020 Note: This representation is based in whole or in part on content supplied by REcolorado®, Inc. REcolorado®, Inc. does not guarantee nor is it in any way responsible for its accuracy. Content maintained by REcolorado®, Inc. may not reflect all real estate activity in the market.
Contact Us Today For More Information 303-726-1874
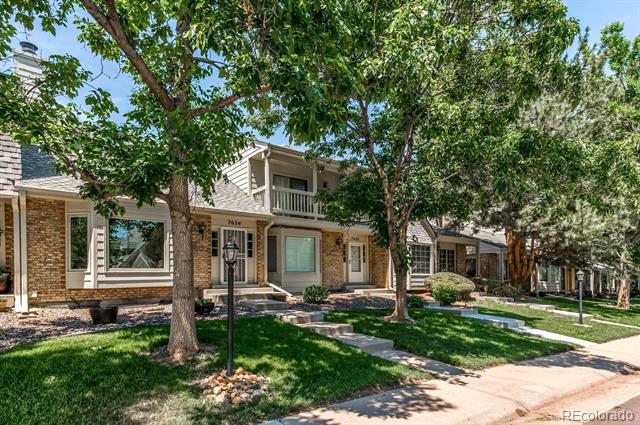
Description: Welcome Home To This Well Maintained Property In Bristol Cove Ii!! This Home Boasts 3 Bedrooms, 4 Bathrooms, A Family Room With A Fire Place, Nice Kitchen/Eating Space, Easy Direct Access From The Road As Well As A Good Sized Two Car Garage Equipped With Lots Of Storage Shelves And Peg Boards To Keep The Pickiest Of Buyers Organized!! This Lovely Property Has Two Master Bedrooms, One Of Which Is On The Main Floor – A True Rare Find!!! At The Top Of The Stairs You Are Greeted By A Tranquil Loft Area Just Outside The Large Upstairs Master Bedroom! The Downstairs Is Roomy In Size Allowing For Rec Room Space, Office Space, A Bedroom, 3/4 Bathroom, Utility Room, And Large Finished Laundry Room With Plenty Of Storage. This Community Has A Swimming Pool Located Just Seconds Up The Street As Well Gated Card Access To Arapahoe Park Just Behind The Pool – A Great Place To Walk And Enjoy On Those Summer Nights After Work! Schedule Your Tour Today And Enjoy All The Tranquility The Bristol Cove Ii Neighborhood And Home Has To Offer! Sellers Hope To Close At The End Of July And Will Consider All Reasonable Offers. Schedule Your Showing Today!
The demand for Centennial Townhomes remains extremely high as Buyers continue their struggle to find available homes. We just created this report for one of our team’s clients, and thought it was worth posting here.
Market Statistics:
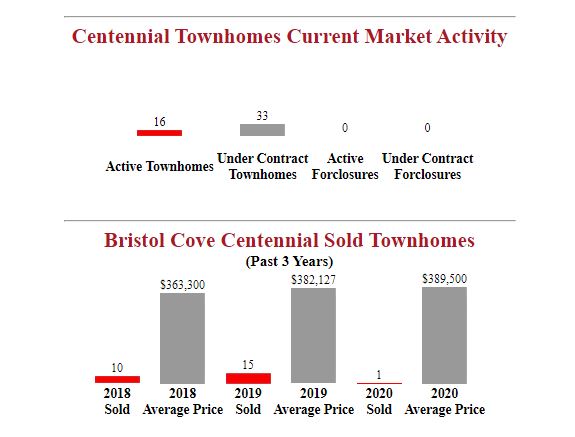
Active Bristol Cove Townhomes on the market: 0.
Active Centennial Townhomes on the market: 16.
There are Currently 0 under contract Bristol Cove Townhomes on the market.
There are currently 33 under contract Centennial Townhomes on the market.
Average prices increased $7,373.00 over the last year from $382,127 to $389,500.
We love seeing positive numbers, and any chart showing year-over-year increases is welcome news.
This data can be a bit complicated. We are always happy to focus our reports or send you more specific details at your request. Our team is always happy to help. Give us a call today at 303-726-1874.
Bristol Cove Centennial Sold Home Data By Month (Past 5 Years)
*This is list of the most recent sold homes for the Bristol Cove Centennial area. Not all homes were sold by The Brian Petrelli Team.
Based on information from REcolorado®, Inc. for the period 2015 through 2020 Note: This representation is based in whole or in part on content supplied by REcolorado®, Inc. REcolorado®, Inc. does not guarantee nor is it in any way responsible for its accuracy. Content maintained by REcolorado®, Inc. may not reflect all real estate activity in the market.
Contact Us Today For More Information 303-726-1874
Beds: 4 Baths: 3 Fin SqFt: 3029 This is the one!! This Woodgate home in award winning Cherry Creek School district features just over 3000 finished square feet! As you pull up you will fall in love with the wild flower garden and beautifully manicured yard! This home faces west you enjoy beautiful sunsets and mountains views! Out back will be your private oasis with a massive 10000 plus square foot lot. You will love entertaining off your huge deck and enjoy all the flowers, vegetation, and trees and landscaping! Take a step into your new home with vaulted entry, all new contemporary flooring throughout your kitchen, formal dining room, family room, den and laundry room! Kitchen countertops have been resurfaced with a modern finish and all stainless steel appliances included. The will want to get cozy in the fantastic family room with an inviting fireplace! Upstairs has all new carpeting and new tile in the master bath and hall bath. 2 bedrooms plus a Huge master bedroom with large master bathroom, this faces west for those sunsets and views! Finally enjoy a bonus 4th non conforming bedroom or large open finished basement and utility room. You truly need to come and tour this home to appreciate all it has to offer! Wonderful neighborhood with immediate access to Southlands, Cherry Creek Park and Reservoir, 225, 470, trails, parks, the list goes on!
Our team continues to be very active in Woodgate Aurora. The low number of available Aurora Homes still poses challenges from as demand from Buyers remains high. One of our team’s clients is considering making on offer on a home in the neighborhood, and we prepared this report for them. We felt it may also help some of you.
Some of the Area’s Highlights:
There are 4 active Woodgate Homes on the market.
There are 687 active Aurora Homes on the market.
Currently under contract Woodgate Homes on the market: 2.
Currently under contract Aurora Homes on the market: 1229.
Average prices decreased $7,628.00 over the last year from $372,471 to $380,099.
We will continue to watch this area and report the numbers here. Hopefully we will see an upward trend in the coming reports.
While this is a wide overview of the market, we can create a more focused, personalized report for you. If you would like our team to complete a detailed market review for your neighborhood. Just give us a call at 303-726-1874.
Woodgate Aurora Sold Home Data By Month (Past 5 Years)
Year
January
February
March
April
May
June
July
August
September
October
November
December
2019
7
2
4
4
3
6
1
5
3
2
2
1
2018
1
2
1
3
3
3
4
3
4
6
2
4
2017
1
0
4
2
5
4
5
2
8
1
4
0
2016
0
0
0
0
0
0
0
0
0
0
0
0
2015
0
0
0
0
0
0
0
0
0
0
0
0
Recent Sold Woodgate Aurora Homes*:
This is a list of the most recent sold Homes. Visit our website for a complete list of all Sold Woodgate Aurora Homes.
Address
Sqft
Beds
Baths
Price
Close Date
4990 S Granby Street
3029
4
3
$485,000
2020-07-31
5219 S Fraser Way
2306
4
3
$510,000
2020-07-31
14821 E Penwood Place
1204
2
2
$282,500
2020-07-31
15080 E Bellewood Drive
2050
3
3
$439,900
2020-06-24
4634 S Fraser Court
1307
3
2
$280,000
2020-07-15
4661 S Fraser Circle
852
1
1
$262,000
2020-07-17
5026 S Evanston Street
1848
3
3
$389,900
2020-07-15
5174 S Fraser Street
3292
4
4
$560,000
2020-06-30
4664 S Fraser Court
1029
1
2
$220,000
2020-07-01
5216 S Fraser Street
3314
4
3
$540,000
2020-06-19
*This is list of the most recent sold homes for the Woodgate Aurora area. Not all homes were sold by The Brian Petrelli Team.
Based on information from REcolorado®, Inc. for the period 2015 through 2020 Note: This representation is based in whole or in part on content supplied by REcolorado®, Inc. REcolorado®, Inc. does not guarantee nor is it in any way responsible for its accuracy. Content maintained by REcolorado®, Inc. may not reflect all real estate activity in the market.
Contact Us Today For More Information 303-726-1874
Beds: 3 Baths: 2 Fin SqFt: 1532 Description: Stop the car! Hurry to this opportunity, this home features a 900 Square foot heated garage with an oversized overhead door! RV, Boat, cars, atvs, bring all your toys! The house also sits on a massive 8000+ square foot lot, with an inviting rear patio and fire pit area, (retractable awning included) perfect for entertaining! Come inside to a contemporary home, 3 Bedroom 2 bath, with true hardwood floors throughout, updated kitchen and baths, stainless steel appliances! The basement boasts a large family room area great for a media room or easily add 4th bedroom, and large utility room! Basement bedroom is non-conforming. Location provides easy access to Downtown, I-25, and I-70! Do not wait to see this home, truly a rare find!
Our team has heard from many clients this month regarding City View Heights Denver Homes. While the demand from homebuyers in the market continues to outpace the available homes, our team is constantly keeping an eye on the inventory of Denver Homes every day, waiting for properties as they are entered into the MLS. We just created this report for one of our team’s clients, and thought it was worth posting here.
Some of the Neighborhood’s Data Points:
Right now, there are 2 active City View Heights Homes on the market.
Right now, there are 2067 active Denver Homes on the market.
There are Currently 3 under contract City View Heights Homes on the market.
There are currently 2022 under contract Denver Homes on the market.
Average prices increased $26,721.00 over the last year from $325,036 to $351,757.
It’s always nice to see home prices in City View Heights Denver rise year-over-year. We’ll see if this trend continues in the months to come.
Many factors go into a report like this. We can get deeper into the details with your personaly if you would like. Want more stats or numbers for this or another area? Give us a call today at 303-726-1874.
City View Heights Denver Sold Home Data By Month (Past 5 Years)
*This is list of the most recent sold homes for the City View Heights Denver area. Not all homes were sold by The Brian Petrelli Team.
Based on information from REcolorado®, Inc. for the period 2015 through 2020 Note: This representation is based in whole or in part on content supplied by REcolorado®, Inc. REcolorado®, Inc. does not guarantee nor is it in any way responsible for its accuracy. Content maintained by REcolorado®, Inc. may not reflect all real estate activity in the market.
Contact Us Today For More Information 303-726-1874